Midyear Results 2016
Pumps Equipment
Sales increased, but order intake decreased in the first half of 2016. The division reported stable operational EBITA and operational ROSA. Sulzer introduced new products that help customers reduce their costs and save energy.
Innovative products that reduce costs and save energy
Sulzer’s new, highly efficient recirculation pump for wastewater treatment brings customers total life cycle cost savings and reduces their environmental footprint. Further, the company launched new lifting station types for the automatic pumping of wastewater and sewage. Sulzer also introduced standardized agitators for the wastewater industry. It can provide these with short lead times and at competitive prices. Moreover, the company added new types of pumps to its submersible dewatering pump range for the mining and construction markets. Sulzer launched a fast-track process to ship its HST turbocompressors to wastewater treatment plants within 36 hours.
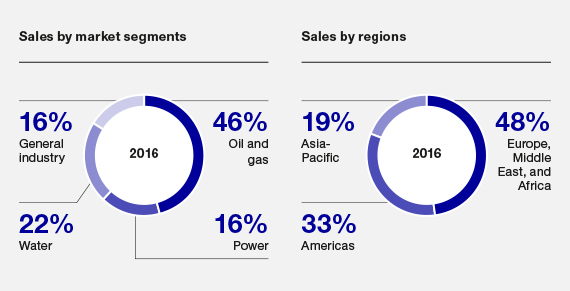
Decrease in order intake
Order intake decreased in the first half of 2016, while order intake gross margin increased. The oil and gas market decreased by over 30% and was the main trigger for the decline in orders. Order intake in the power and water markets increased, while it remained stable in the general industry market. Regionally, demand in Europe and Africa decreased significantly, whereas the Middle East grew. Order intake in the Americas dropped, whereas Asia-Pacific was above last year’s level.
Sales increased — operational EBITA and operational ROSA were stable
Sales improved from the first half of the previous year. The high order backlog in the power market and strong performance in the parts, retrofit, and nuclear business mainly contributed to the increase. The division reported stable operational EBITA and operational ROSA.
Key figures Pumps Equipment
January 1 – June 30
| millions of CHF | 2016 | 2015 | Change in +/-% | +/-%1) |
| Order intake | 730.5 | 834.8 | – 12.5 | – 11.5 |
| Order intake gross margin | 34.7% | 33.0% | ||
| Order backlog as of June 30 / December 31 | 981.7 | 998.0 | – 1.6 | |
| Sales | 745.6 | 726.7 | 2.6 | 3.3 |
| EBIT | 15.2 | 20.5 | – 25.9 | |
| opEBITA | 31.7 | 31.7 | 0.0 | 2.5 |
| opROSA | 4.3% | 4.4% | ||
| Employees (number of full-time equivalents) as of June 30 / December 31 | 6 610 | 6 996 | – 5.5 |
1) Adjusted for currency effects.
If not otherwise indicated, changes compared with the previous year are based on currency-adjusted figures.
EBIT: Operating income
ROS: Return on sales (EBIT/sales)
opEBITA: Operating income before restructuring, amortization, impairments, and non-operational items
opROSA: Return on sales before restructuring, amortization, impairments, and non-operational items (opEBITA/sales)