Midyear Results 2016
Rotating Equipment Services
Order intake and sales decreased in the first half of 2016. Compared with the same period of the previous year, operational EBITA and operational ROSA improved. The division secured a large multiyear service contract in South Africa and achieved positive results from its restructuring.
Large service contract in South Africa
Sulzer secured a large multiyear maintenance and fuel conversion contract for a gas turbine power plant in South Africa. The turbines of the plant currently run on diesel. Sulzer’s engineers will convert the turbines to run on gas, which will decrease the fuel costs. Rotating Equipment Services will perform the field service, supply parts, train the personnel, and provide intellectual property related to the field service.
Further, the division continued to integrate its service business. In Singapore, Sulzer combined its shops for pumps and turbomachinery services. The restructuring in Europe, Middle East, and Africa (EMEA) — especially in the Netherlands — showed positive results. The division continued to focus on improving performance in the UK.
Decrease in order intake
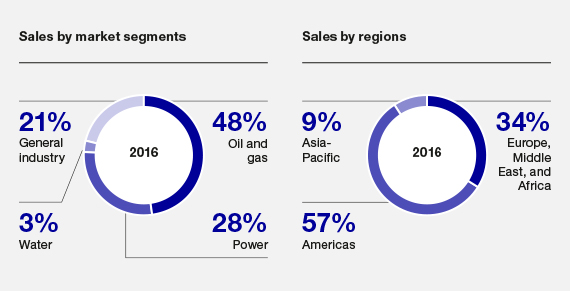
Order intake decreased from the first half of the previous year. A weak demand in EMEA — particularly in the UK — mainly caused the decline. Order intake gross margin decreased. Order intake in the oil and gas market dropped. Order intake in the power market was flat and grew in the general industry market. Demand in the Americas was on last year’s level, despite very challenging market conditions in South America. It partially compensated for the decrease in EMEA and Asia-Pacific.
Improved operational EBITA and operational ROSA despite lower sales
In the first half of 2016, sales decreased. The decline mainly stems from a decrease in sales in EMEA and Asia-Pacific. Operational EBITA improved compared with the first half of 2015. The restructuring in EMEA showed significant positive results and contributed to the division’s operational EBITA improvement. Operational ROSA improved, in part, because of cost measures in EMEA.
Key figures Rotating Equipment Services
January 1 – June 30
| millions of CHF | 2016 | 2015 | Change in +/-% | +/-%1) |
| Order intake | 344.2 | 364.0 | – 5.4 | – 3.7 |
| Order intake gross margin | 30.4% | 30.6% | ||
| Order backlog as of June 30 / December 31 | 224.0 | 205.0 | 9.3 | |
| Sales | 324.6 | 334.0 | – 2.8 | – 1.4 |
| EBIT | 25.0 | 22.7 | 10.1 | |
| opEBITA | 30.3 | 27.8 | 9.0 | 6.5 |
| opROSA | 9.3% | 8.3% | ||
| Employees (number of full-time equivalents) as of June 30 / December 31 | 3 483 | 3 538 | – 1.6 |
1) Adjusted for currency effects.
If not otherwise indicated, changes compared with the previous year are based on currency-adjusted figures.
EBIT: Operating income
ROS: Return on sales (EBIT/sales)
opEBITA: Operating income before restructuring, amortization, impairments, and non-operational items
opROSA: Return on sales before restructuring, amortization, impairments, and non-operational items (opEBITA/sales)